If you’re the type that likes to dig deeper into tech, into the depths of the operating system and compiled code, then the August RISE meeting was for you. Shane Kennedy presented part 1 of a multi-part series on software exploit development that laid foundational concepts of software exploits such as buffer overflows.
This initial dive into software exploit development included several key points of knowledge regarding OS execution and memory spaces, compiled binary file formats, file and debugging tools, and basic assembly instructions. Discussion started with a quick understanding of x86 processor registers especially index registers for the stack base, top of stack pointer, and index pointer. This led to an understanding of memory locations with respect to where different parts of the program are stored, with special emphasis on the stack due to its importance in program flow as functions are called.

Debugging…or re-bugging?
Shane then reviewed some basic tools available on most Linux distributions for viewing various information on compiled binary files. These tools can provide a breakdown of the file sections and available functions and are valuable for understanding the target program and looking for potential vulnerable areas. Key tools that saw heavy use were the hex and object dump utilities, xxd and objdump, and the binary file utility readelf. Several usage examples familiarized attendees with the output and preparation for the upcoming exploit demo.
As this was a intro-level demonstration it focused on 32-bit binaries to keep things simplified. Also several caveats were made including disabling of stack protection ‘canaries’ and address space layout randomization (ASLR). These protection measures are typically enabled and provide protection against the simple exploit used in this demonstration but the concepts remain valid and crucial for building up to more sophisticated attacks in later sessions.
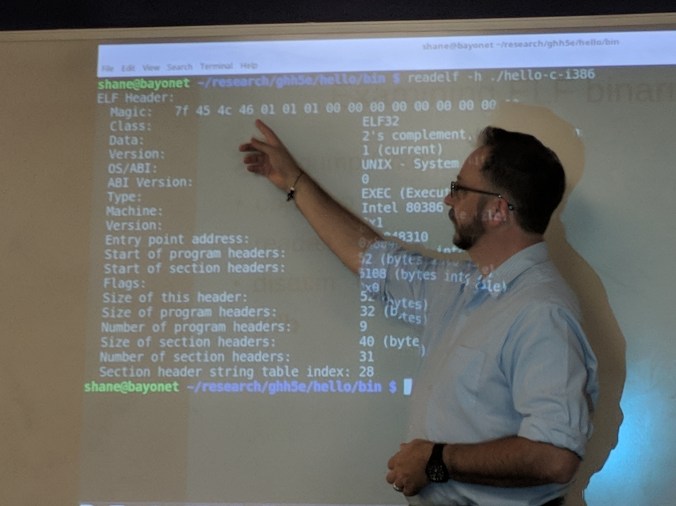
Comparing the ELF magic number to the raw hex output of the binary file
The demonstration centered on an executable compiled from C with a couple of functions that printed an argument to the screen using a vulnerable function (strcpy). Analysis of the file with a debugger and the tools covered earlier showed the stack at various points of the program’s execution, ending with a successful buffer overflow exploit that rewrote the return pointer and executed another function. With a bit of additional code, the buffer overflow was exploited and a NOP sled used to execute code providing shell access. It was an eye-opening demonstration of how exploits work, and alluded to other key security strategies including sanitizing inputs, log review, and least-privilege execution.
Even with caveats the demonstration explained many concepts core to exploit development and will help step into more complex tasks in future sessions. Though the concepts and knowledge required can be considered complex, the tools and resources are readily available and at low cost making the skills available to virtually anyone with time to learn and experiment. References listed below were recommended by several attendees of the meeting and provide a good starting point for deeper understanding of the subject.
Thanks to Shane Kennedy for developing and presenting this series, and to ECPI for hosting this event. RISE will be back in September for another great session!
Suggested Reading:
Gray Hat Hacking: The Ethical Hacker’s Handbook
Hacking: The Art of Exploitation
Hacking Exposed
The Art of Assembly Language
The Art of Debugging with GDB and DDD
Intel® 64 and IA-32 Architectures Software Developer’s Manual
elf, file, gcc, gdb, hexdump, ld, nasm, ndisasm, objdump, proc, strcpy, strncpy, syscall, syscalls, xxd
